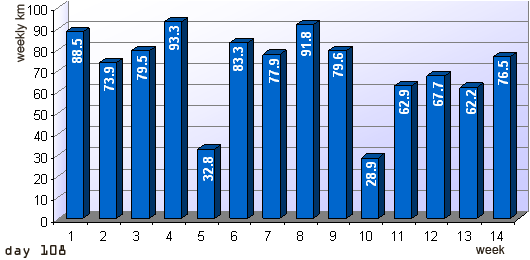
there’s a saying in finnish, “the longer the distance, the more stupid the lad”. most probably the surroundings here don’t see our hero micke-midlife as very smart. 1020km, to be precise, in the first 100 days - the above graph leaves out the sunday run on Aug 24 and the monday run in week 15. that’s on average 10.2km per day.
the graph above shows very well the initial enthusiasm, an easy week to recover, and then 4 weeks of preparation for the first 10k test race. the last 4 weeks were after the daylight saving switch and with nasty rainy conditions, a tough call for a “sun-shine-runner”. the second test race in week 13 benefitted still from the earlier training in weeks 6 through 10 and from a reduced amount of km in the following weeks.
other development over these weeks: weight has gone down by 6 kg. running speed during training has improved for the interval runs. whereas in the beginning 4×1000m in 3:40min were a challenge, it’s now the 8×1000m in around 3:30min. otherwise not much difference, longer runs are done at average speeds between 4:10 and 5:15min/km. One clear change has been the heart rate. whereas it went up to rate like 193bpm on those several fierce one-hour runs in the early summer, it won’t go beyond 180bpm during a 10k race now. that’s a clear difference. does it have to do with too little sleep? that’s definitely the single biggest challenge in this project.
looking forward, the 65 - 75km weeks are not sustainable. hence last week’s (week 15) total was slightly upped and this week looks good too.


Leave a Reply
You must be logged in to post a comment.